
In the world of business analytics, understanding data is key. One statistical concept that’s particularly useful is the Calculating Z-Score in Business Analytics 2024. This simple, yet powerful statistic provides insights into how individual data points relate to the overall data set.
Today, we’re going to demystify the process of Z-Score calculation by hand, using practical examples from the business world.
Table of Contents
The Z-Score, also known as a standard score, measures how many standard deviations a data point is from the mean of a data set. By calculating the Z-Score, you can understand the relative position of a data point within the data set.
This can be especially useful in business scenarios where you need to compare different data sets or understand outliers.
Calculating Z-Score from Summary Data
First, let’s look at an example where we have the mean (μ) and standard deviation (σ) of a data set. Say you are a business owner who has collected monthly sales data over the past year. Your average monthly sales (μ) are $50,000, with a standard deviation (σ) of $10,000.
If you want to know how exceptional a month with sales of $70,000 is, you can calculate the Z-Score as follows:

Where:
- X is the data point you’re examining (in this case, $70,000),
- μ is the mean of the data set (in this case, $50,000), and
- σ is the standard deviation of the data set (in this case, $10,000).
Calculating Z-Score from Raw Data
Now, let’s consider a scenario where you only have the raw data. Suppose you run a small retail store, and you’ve recorded the following sales figures for the last seven days: $200, $220, $250, $230, $210, $240, $230.
First, you need to calculate the mean (μ) and standard deviation (σ) of your data set. The mean is the sum of all data points divided by the number of data points, and the standard deviation is the square root of the variance (the average of the squared differences from the mean).
In this case, the mean is $226.43, and the standard deviation is $18.27. Now, you can calculate the Z-Score for each day using the formula mentioned earlier.
For instance, the Z-Score for the $250 sales day would be (250 – 226.43) / 18.27 = 1.29. This sales figure is 1.29 standard deviations above the average, indicating a relatively high sales day.
Understanding how to calculate Z-Scores by hand gives you a powerful tool for interpreting your business data. With this knowledge, you can identify outliers, understand variations in your data, and make more informed business decisions.
Remember, while the Z-Score is a useful statistical measure, it is not the only one. Always consider the context of your data and use other statistical tools as necessary to gain a comprehensive understanding of your business performance.
In conclusion, the Z-Score is a simple and effective statistical tool that can provide valuable insights into your business data. By knowing how to calculate and interpret Z-Scores, you can leverage this tool to drive informed decision-making and improve your business performance.
Whether you’re dealing with sales figures, customer reviews, or website traffic, understanding Z-Scores can help you make sense of your data and use it to your advantage.
I hope you find this guide to calculating Z-Scores by hand helpful. Remember, statistics is not just about crunching numbers – it’s about understanding your business in a deeper, more meaningful way. So, don’t be afraid to dive into your data and see what it has to say!
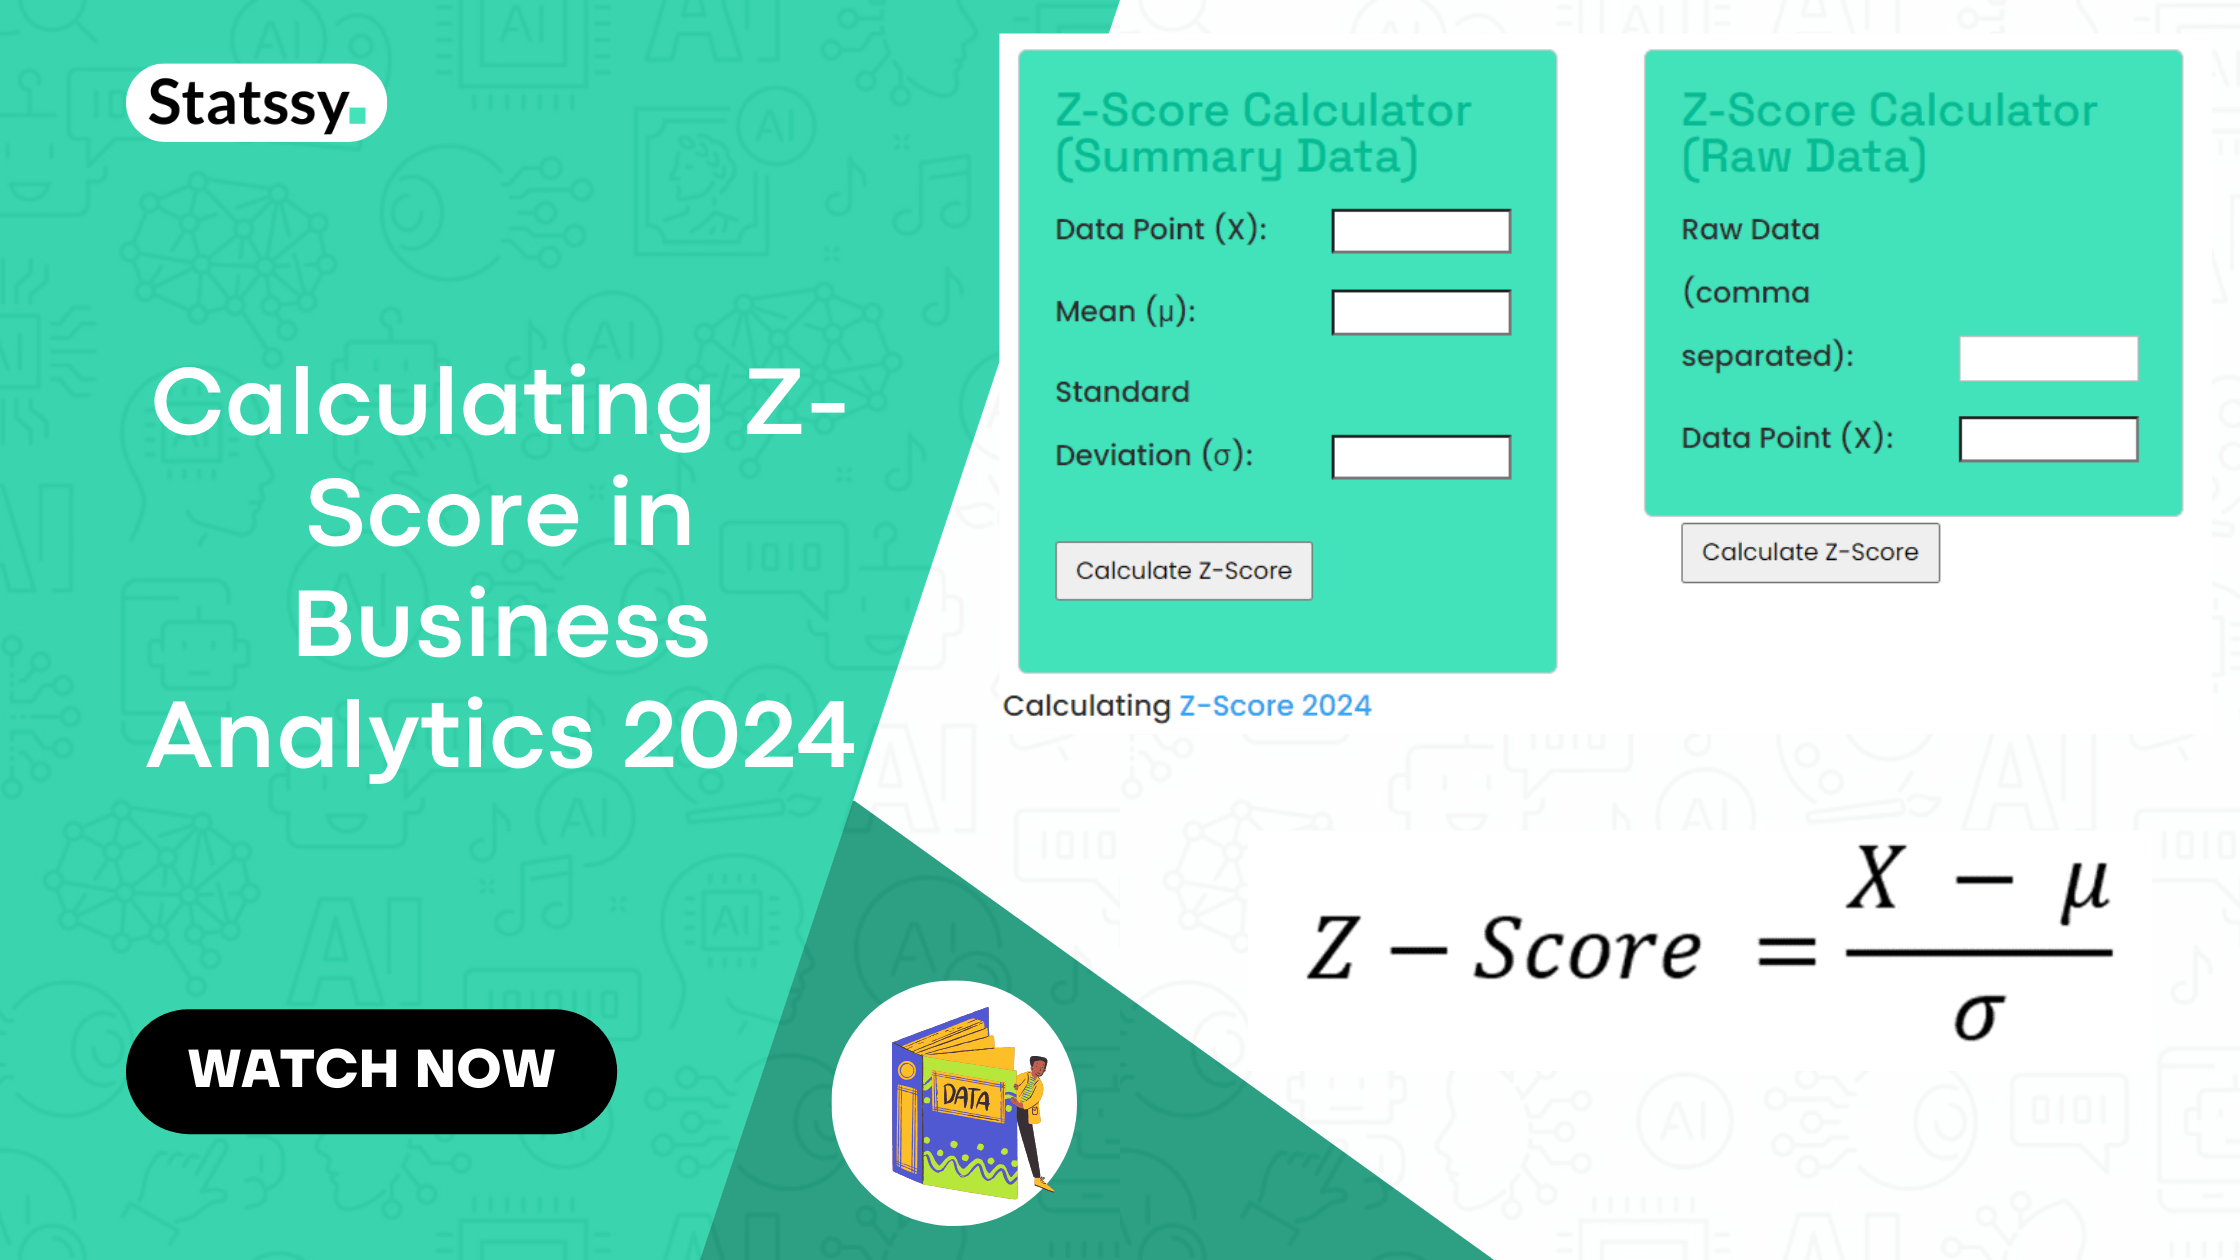
Now if you want to Calculating Z-Score in Business Analytics 2024 from your summary data, use the calculator below
Z-Score Calculator (Summary Data)
Z-Score Calculator (Raw Data)
Calculating Z-Score 2024


