
Calculate Simple Linear Regression and Residuals by Hand (Step by Step)

What is simple linear regression?
Simple linear regression is a statistical method that allows us to summarize and study relationships between two continuous (quantitative) variables:
- One variable, denoted x, is regarded as the predictor, explanatory, or independent variable.
- The other variable, denoted y, is regarded as the response, outcome, or dependent variable.
Example for simple linear regression
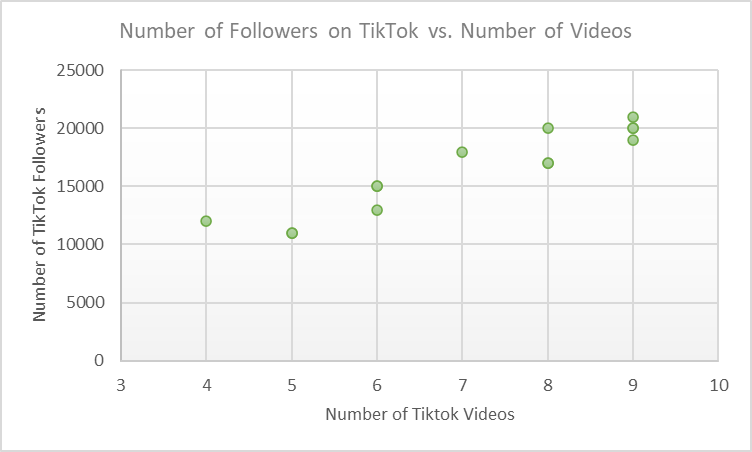
To make things simple, I am assuming the number of TikTok videos is the independent variable (x) and the number of TikTok followers is the dependent variable (y). We will see how simple linear regression can help us understand relation between TikTok videos and TikTok followers.
This is the data that we have

This is how it will look like when we plot it using a scatterplot
Mathematical model for simple linear regression
The simple linear regression model can be written as:
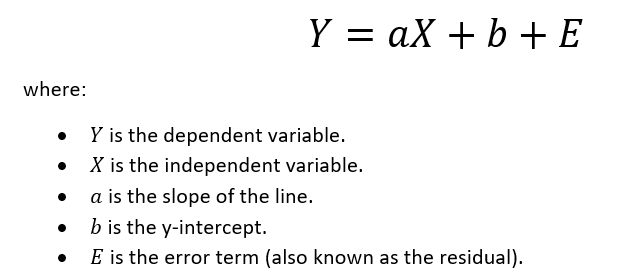
The goal of simple linear regression is to create a linear model that minimizes the sum of squares of the residuals/error terms.
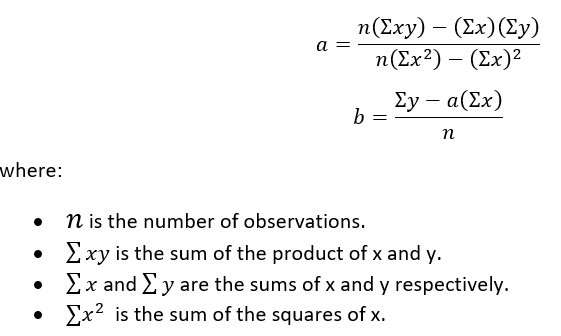
What is the formula for slope and intercept for simple linear regression?
The formulas to calculate the slope (a) and y-intercept (b) are:

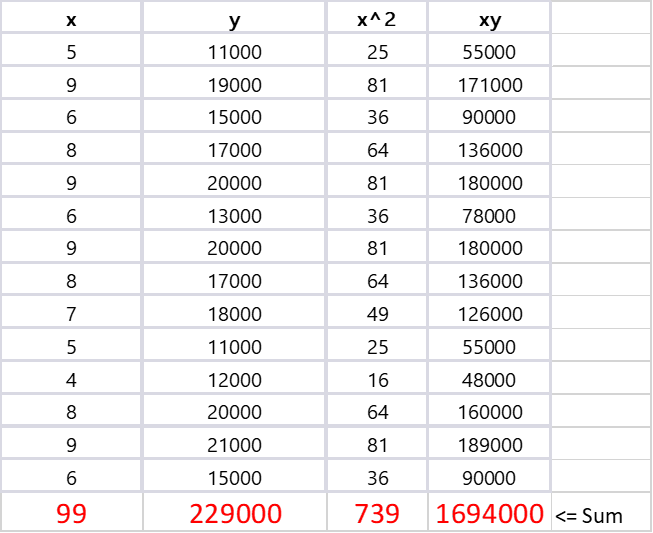
This table shows the values of x (number of TikTok videos), y (number of TikTok followers), x^2 (square of the number of videos), and xy (product of the number of videos and followers) for each observation in the data. These values are used to calculate the slope and y-intercept of the regression line.
Let’s substitute the values we calculated earlier into these formulas:
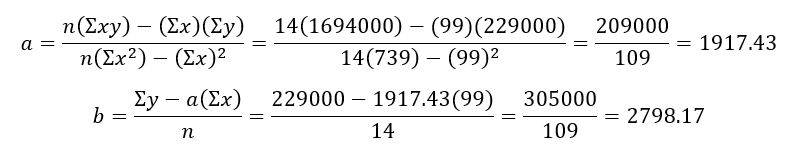
The calculated slope (a) and y-intercept (b) in decimal form are:
Slope (a): 1917.43
Y-intercept (b): 2798.17
So, the equation of the line is:
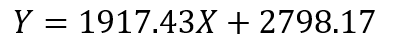
This means that for each additional TikTok video, we can expect on average an increase of approximately 1917 followers, assuming that the relationship between the number of videos and followers is linear.
The y-intercept of 2798.17 is the expected number of followers when the number of TikTok videos is zero. However, in this context, the y-intercept doesn’t have a practical interpretation because it’s unlikely for someone to have followers without any videos.
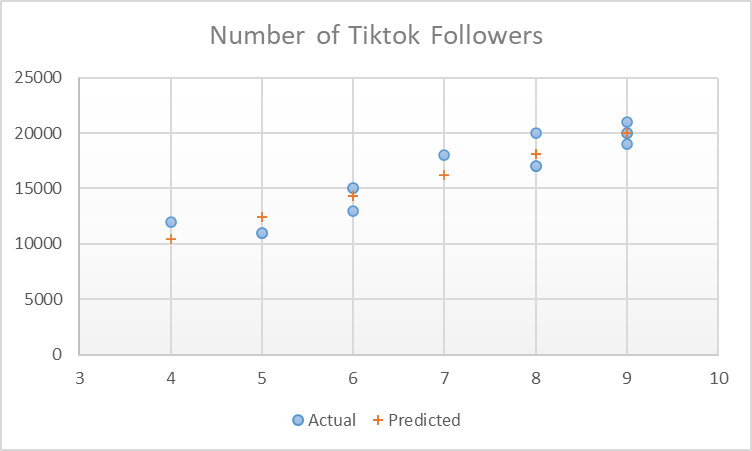
Now, if we plot the regression data points, we will see something like this
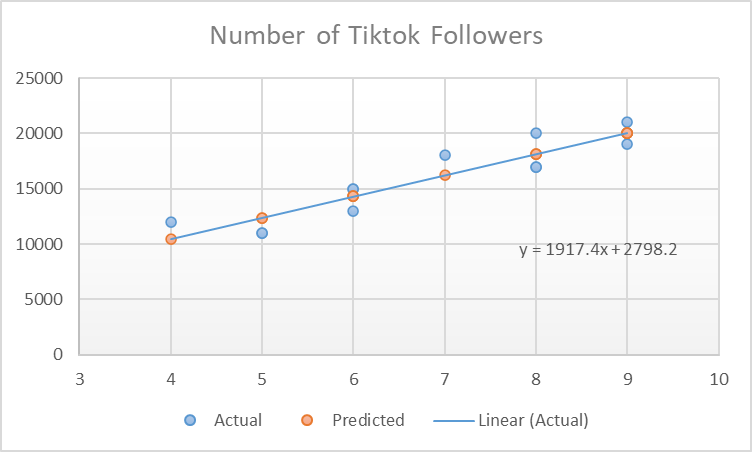
Then if you connect the predicted values to create a regression line, it will look something like this
Residuals in Simple Linear Regression
Residuals in simple linear regression are the differences between the observed (actual) and predicted values of the dependent variable. In other words, a residual is the error in the prediction made by the model for a specific observation.
The formula for calculating a residual for a specific observation is:
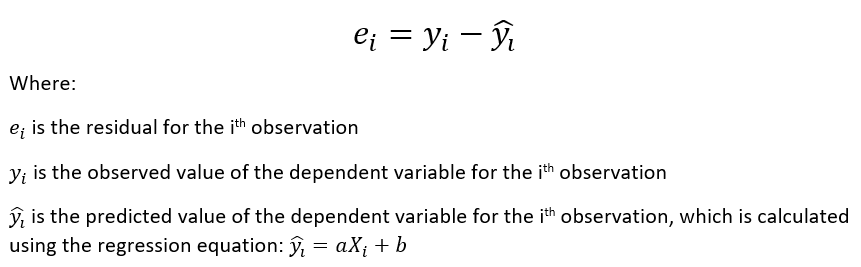
Let’s calculate the residuals for our data. We’ll use the regression equation we derived earlier:
“Predicted y” calculations:
- For x = 5: (Y = 1917.43*5 + 2798.17 = 12385.32)
- For x = 9: (Y = 1917.43*9 + 2798.17 = 20055.04)
- For x = 6: (Y = 1917.43*6 + 2798.17 = 14302.75)
- For x = 8: (Y = 1917.43*8 + 2798.17 = 18137.61)
- For x = 9: (Y = 1917.43*9 + 2798.17 = 20055.04)
- For x = 6: (Y = 1917.43*6 + 2798.17 = 14302.75)
- For x = 9: (Y = 1917.43*9 + 2798.17 = 20055.04)
- For x = 8: (Y = 1917.43*8 + 2798.17 = 18137.61)
- For x = 7: (Y = 1917.43*7 + 2798.17 = 16220.18)
- For x = 5: (Y = 1917.43*5 + 2798.17 = 12385.32)
- For x = 4: (Y = 1917.43*4 + 2798.17 = 10467.89)
- For x = 8: (Y = 1917.43*8 + 2798.17 = 18137.61)
- For x = 9: (Y = 1917.43*9 + 2798.17 = 20055.04)
- For x = 6: (Y = 1917.43*6 + 2798.17 = 14302.75)
For residuals I am giving a few as examples, rest you can calculate.
“Residual” calculations:
- For y = 11000: (11000 – 12385.32 = -1385.32)
- For y = 19000: (19000 – 20055.04 = -1055.04)
- For y = 15000: (15000 – 14302.75 = 697.25)
- For y = 17000: (17000 – 18137.61 = -1137.61)
- For y = 20000: (20000 – 20055.04 = -55.04)
- For y = 13000: (13000 – 14302.75 = -1302.75)
- For y = 20000: (20000 – 20055.04 = -55.04)
- For y = 17000: (17000 – 18137.61 = -1137.61)
- For y = 18000: (18000 – 16220.18 = 1779.82)
- For y = 11000: (11000 – 12385.32 = -1385.32)
Ultimately, in the result you will get this table

The “Predicted y” column represents the predicted number of TikTok followers based on our linear regression model. The “Residual” column represents the difference between the actual number of followers and the predicted number of followers.
A positive residual means that the actual number of followers is higher than what our model predicted, while a negative residual means that the actual number of followers is lower than what our model predicted.
These residuals are important because they tell us how well our model is performing. If the residuals are small, it means our model is doing a good job of predicting the number of followers. If the residuals are large, it means our model is not doing as well. In this case, the residuals vary quite a bit, which suggests that while our model may be somewhat useful for predicting the number of followers based on the number of videos, there are likely other factors at play that our model does not account for.
I hope you enjoyed learning this technique of calculation. Please let me know if you need any help with regression.